cat-iot · 2023-01-30
Energy Cost Dashboard
A unified sub-metering console combining main-panel kWh consumption, LWBP/WBP tariff cost curves, peak kW demand, and real-time power factor (cos φ) telemetry.
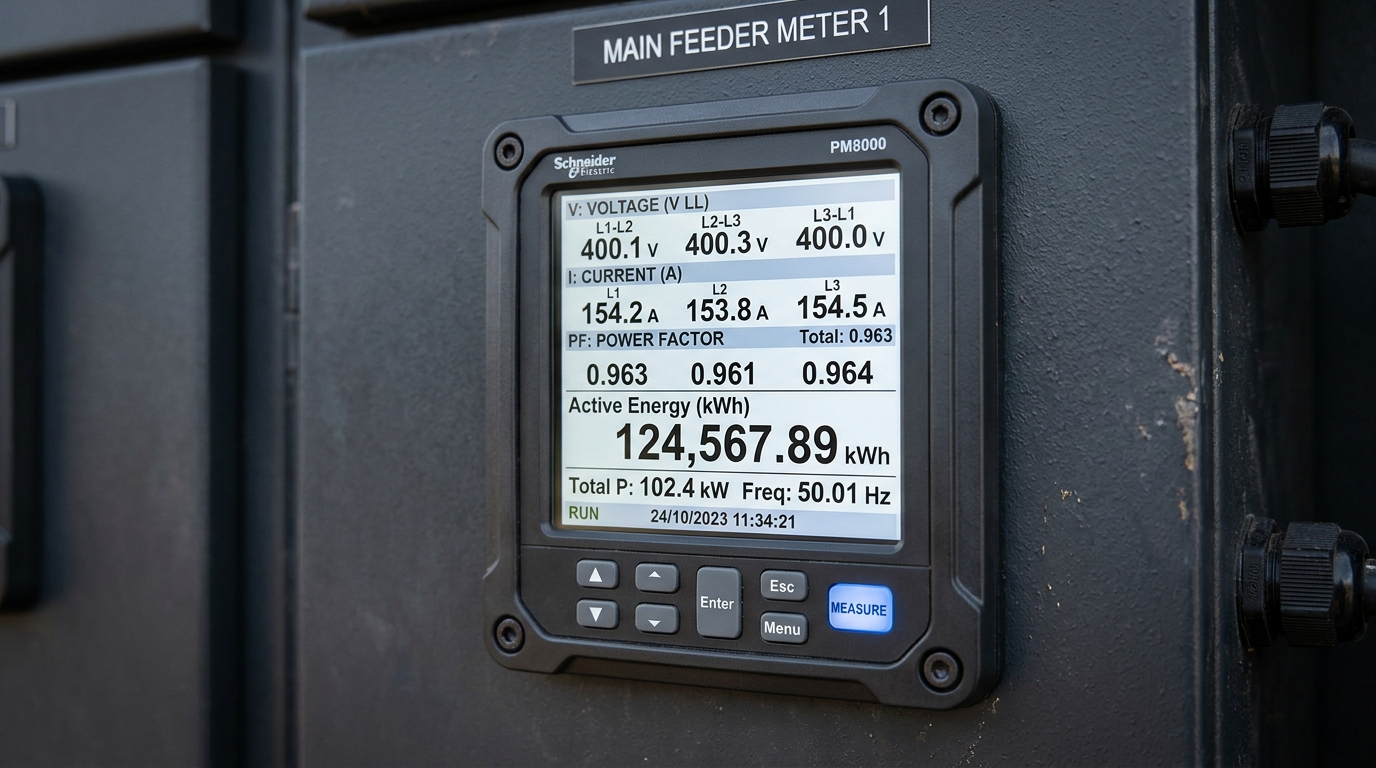
The Realtime Energy Cost Dashboard consolidates main switchboard kWh sub-metering, PLN LWBP/WBP tariff windows, peak kW demand, and real-time power factor (cos φ) telemetry into one operational console built for commercial towers and hospitality properties.
Core Monitored Parameters
- Daily & Monthly Energy Consumption (kWh): Segmented clearly into off-peak (LWBP) and evening peak (WBP) tariff blocks.
- Peak Demand Tracking (kW): Alerts chief engineers before chiller or kitchen startups exceed contracted transformer capacity.
- Live Power Factor (cos φ): Monitors capacitor bank health to prevent monthly PLN reactive energy (kVArh) penalties.
- Estimated Daily Utility Cost (IDR): Translates raw electrical pulses into transparent daily financial budgets.
Operational Value for Property Management
With centralized sub-meter telemetry, engineering and asset management teams detect abnormal overnight base loads—such as stuck cooling tower fans, running booster pumps, or unscheduled chiller stages—and compare efficiency benchmarks across multiple properties from one screen.